MathJax

MathJax-2

MathJax-3

Google Code Prettify

置頂入手筆記

EnterproseDB Quickstart — 快速入門筆記

由於考慮採用 EnterpriseDB 或是直接用 PostgreSQL 的人,通常需要一些入手的資料。這邊紀錄便提供相關快速上手的簡單筆記 ~ 這篇筆記以 資料庫安裝完畢後的快速使用 為目標,基本紀錄登入使用的範例:

2016年8月22日 星期一

EDB 功能 - Optimizer Hints

在 PostgreSQL 中要影響執行計畫,就是透過 PostgreSQL 的 GUC 參數,對 Query Planner 選用執行計畫優先順序影響。

而 PostgreSQL 企業版則提供直接影響 Query Plan 的工具 — Optimizer hints,能夠以用 Oracle 的 Optimizer Hints 工具的使用方式,去影響 Postgres Query Planner 的行為。

Optimizer hints 將 Postgres 裡面的可行的設置方式,對照成 「Oracle-Style」 的 Optimizer Hint,直接對執行計畫進行動作的開關。如果 Query Planner 對於所指令的 Hint 找不到符合的執行計畫,這個 Hint 就會被忽略。

由於 Hint 是包在註解中的,於是如果 Hint 沒有被理會,也不會跳出任何錯誤的。

使用方式,是採用多行註解進行 Hint 的指定,適用於 SELECT、INSERT、UPDATE、DELETE 等 SQL 指令:
SELECT
/*+
放置 Hint 內容
*/
col_list FROM tbl;

以下利用企業版內建範例表格 emp,作一個簡單示範:
edb=# explain SELECT /*+ FIRST_ROWS(1) */ * FROM emp ORDER BY empno;               
                            QUERY PLAN                            
---------------------------------------------------------------------
 Index Scan using emp_pk on emp  (cost=0.14..10.85 rows=14 width=45)
(1 row)

edb=# explain SELECT /*+ FULL(emp) */ * FROM emp ORDER BY empno;
                       QUERY PLAN                       
-----------------------------------------------------------
 Sort  (cost=1.41..1.44 rows=14 width=45)
   Sort Key: empno
   ->  Seq Scan on emp  (cost=0.00..1.14 rows=14 width=45)
(3 rows)

根據使用手冊,目前 9.5 企業版可以指定與 Oracle Optimizer Hint 相容的的有:
類型
Hint
Row Number Correction
CHOOSE
ALL_ROWS
FIRST_ROWS
FIRST_ROWS_10
FIRST_ROWS_100
FIRST_ROWS_1000
FIRST_ROWS(數量)
Scan Method
FULL(表格名稱)
INDEX(表格名稱 INDEX名稱)
NO_INDEX(表格名稱 INDEX名稱)
Join Method
USE_HASH(表格名稱)
NO_USE_HASH(表格名稱)
USE_MERGE(表格名稱)
NO_USE_MERGE(表格名稱)
USE_NL(表格名稱)
NO_USE_NL(表格名稱)
Join Order
ORDERED


最後,社群也有針對 postgreSQL 開發出 Hint 套件,稱為 pg_hint_plan。不過該套件和 EDB 企業版內建的 Optimizer Hints 相比較,企業版仍然想辦法對應 Oracle 提供的 Hints 種類為主;而 pg_hint_plan 則是以 postgresql.conf 設定檔內的 Planner Method Configuration 小節對應的 Planner Methode 為主(詳見 Hint 支援清單),對於 Oracle 習慣用戶來說,還是從 Postgres 企業版比較親切一些。

參考

Postgres Query Optimizer 基本觀念:Hinting at PostgreSQL | Blog - 2ndQuadrant


其他資料:


社群版相似工具: pg_hint_plan
相關資料:

EDB 的 Index 輔助建議功能 - Index Advisor

EDB 在企業版 EDB Postgres Advanced Server 提供協助建立 INDEX 的工具,主要以提供 B-Tree Index 建議為主,目前還不包含 PostgreSQL 提供的其他類型 INDEX(Hash Index、GiST IndexspGiST IndexGIN IndexBRIN Index)。

Index Advisor 會藉由假定暫時的 Index,對於給定的 SQL 指令,產生不同的 Query Plan,並計算個別 Cost Esitmation,找出最佳的 Index 設置組合,然後輸出建議的 CREATE INDEX 指令。

Index Advisor 只會產生建議 Index 的 SQL 指令(輸出到檔案),不會擅自建立這些 Index。

在此練習使用 Index Advisor 的指令工具 pg_advise_index 以及 psql 下的操作方式。此處使用的版本為 EPAS 9.5 版。

執行之前,要先對準備考慮加入 Index 的表格執行 ANALYZE,進行 Query Planner 要參考的採樣資訊更新,才會有比較貼近現況的建議。

要在資料庫內部啟用 Index Advisor,直接執行安裝的 Script 即可
edb=# \i /opt/PostgresPlus/9.5AS/share/contrib/index_advisor.sql
CREATE TABLE
CREATE INDEX
CREATE INDEX
CREATE FUNCTION
CREATE FUNCTION
CREATE VIEW

弄好 Index Advisor 相關物件後,可以開始使用。

以下將以一個簡單例子作示範:
在此以用以下的表格以及插入資料
CREATE TABLE tstabcd(
id INT,
intime TIMESTAMP WITH TIME ZONE,
mystr TEXT);
INSERT INTO tstab VALUES (
generate_series(1,100000),
now(),
random()::TEXT );

上面的例子,我們可以預期,在 id 欄位上放一個 Primary Key 比較好。

接著便來看看 Index Advisor 如何使用。

Index Advisor 有兩種模式: psql 下的一個 Session 內進行追蹤,以及指令工具 pg_advise_index。

psql 下操作:要啟動 Index Advisor 進行分析、紀錄前,需要先載入 index_advisor 模組,然後於過程中,Index Advisor 便會將建議紀錄到 index_advisor_log 中,便可以用 show_index_recommandations() 或 index_recommendations 進行查看。
edb=# LOAD 'index_advisor';                                                     
LOAD
edb=# select * from tstabcd where id < 400;
id  |        mystr        |              intime            
-----+---------------------+----------------------------------
  1 | 0.887104642577469   | 22-AUG-16 07:15:32.843803 +00:00
  2 | 0.659782143775374   | 22-AUG-16 07:15:32.843803 +00:00
  3 | 0.966384563129395   | 22-AUG-16 07:15:32.843803 +00:00
  4 | 0.953097302932292   | 22-AUG-16 07:15:32.843803 +00:00
  5 | 0.120846566744149   | 22-AUG-16 07:15:32.843803 +00:00
  6 | 0.559676289092749   | 22-AUG-16 07:15:32.843803 +00:00
  7 | 0.541864807717502   | 22-AUG-16 07:15:32.843803 +00:00
  8 | 0.913167451974005   | 22-AUG-16 07:15:32.843803 +00:00
  9 | 0.864201350603253   | 22-AUG-16 07:15:32.843803 +00:00
 10 | 0.361520271748304   | 22-AUG-16 07:15:32.843803 +00:00
 11 | 0.444020337890834   | 22-AUG-16 07:15:32.843803 +00:00
 12 | 0.067021322902292   | 22-AUG-16 07:15:32.843803 +00:00
 13 | 0.340361757669598   | 22-AUG-16 07:15:32.843803 +00:00
 14 | 0.66826061764732    | 22-AUG-16 07:15:32.843803 +00:00
 15 | 0.350825355388224   | 22-AUG-16 07:15:32.843803 +00:00
 16 | 0.391068525612354   | 22-AUG-16 07:15:32.843803 +00:00
 17 | 0.441221610177308   | 22-AUG-16 07:15:32.843803 +00:00
 18 | 0.921129890717566   | 22-AUG-16 07:15:32.843803 +00:00
 19 | 0.225387694779783   | 22-AUG-16 07:15:32.843803 +00:00
 20 | 0.504998795688152   | 22-AUG-16 07:15:32.843803 +00:00
 21 | 0.368924054317176   | 22-AUG-16 07:15:32.843803 +00:00
edb=# SELECT show_index_recommendations(NULL);
                                               show_index_recommendations                                          
------------------------------------------------------------------------------------------------------------------------
 create index idx_tstabcd_id on enterprisedb.tstabcd(id);/* size: 2624 KB, benefit: 1964.68, gain: 0.748734776566668 */
(1 row)

edb=# select * from index_recommendations;
 backend_pid |                                               show_index_recommendations                                            
-------------+------------------------------------------------------------------------------------------------------------------------
        2855 | create index idx_tstabcd_id on enterprisedb.tstabcd(id);/* size: 2624 KB, benefit: 1964.68, gain: 0.748734776566668 */
(1 row)

Command-Line 下:將需要考慮的 SQL 指令放到檔案中,由 pg_advise_index 載入並將建議的 CREATE INDEX 指令寫到檔案中
[enterprisedb@edbvm ~]$ # 把需要分析的 SQL 寫到檔案裡
[enterprisedb@edbvm ~]$ echo 'select * from tstabcd where id < 400;' >> ~/test.sql
[enterprisedb@edbvm ~]$ # 接著進行分析
[enterprisedb@edbvm ~]$ pg_advise_index -p 5432 -s 100M -o ~/advise.sql ~/test.sql
poolsize = 102400 KB
load workload from file '/home/enterprisedb/test.sql'
Password:
Analyzing queries . done.
size = 2624 KB, benefit = 1964.680000
/* 1. tstabcd("id"): size=2624 KB, benefit=1964.68 */
/* Total size = 2624KB */
[enterprisedb@edbvm ~]$ # 最後查看建議內容
[enterprisedb@edbvm ~]$ cat ~/advise.sql
create index "idx_tstabcd_id" on "enterprisedb"."tstabcd" ("id");

如果認為 Index Advisor 所建議的指令可以用,就執行這些指令即可。
edb=# -- 建立所建議的 Index 之前
edb=# explain select * from tstabcd where id < 400;
                        QUERY PLAN                        
-------------------------------------------------------------
 Seq Scan on tstabcd  (cost=0.00..1986.00 rows=423 width=30)
   Filter: (id < 400)
(2 rows)
edb=# -- 建立所建議的 Index
edb=# \i ~/advise.sql
CREATE INDEX
edb=# explain select * from tstabcd where id < 400;
                                   QUERY PLAN                                  
----------------------------------------------------------------------------------
 Index Scan using idx_tstabcd_id on tstabcd  (cost=0.29..21.20 rows=423 width=30)
   Index Cond: (id < 400)
(2 rows)

以上便是 Index Advisor 的操作。

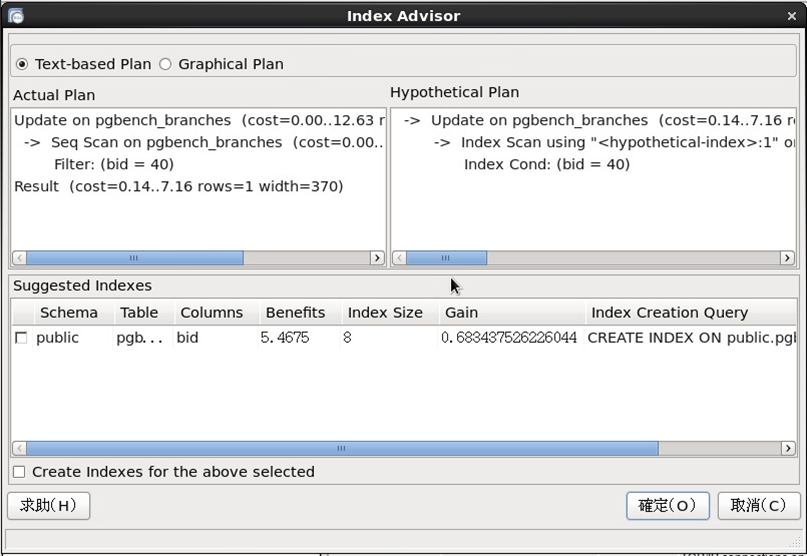
最後,Index Advisor 也有整合到 EDB 的監控/開發工具 - Postgres Enterprise Manager Client 內,詳情請參考使用手冊。以下為對 pgbench 活動分析的截圖

SQL Profiler 追蹤活動:
圖片2.png

Index Advisor GUI 對選取的追蹤活動產生建議:
圖片1.png

參考:

2016年8月12日 星期五

列舉 PostgreSQL 記憶體用量的一個方法

在此作個小小紀錄...

一個 PostgreSQL 程序,會有下列的 Process:

[enterprisedb@edbvm ~]$ ps aux|grep postgres
enterpr+  1235  0.0  1.9 623920 29472 ?        S    10:08   0:00 /opt/PostgresPlus/9.5AS/bin/edb-postgres -D /opt/PostgresPlus/9.5AS/data
enterpr+  1255  0.0  0.0 209936  1412 ?        Ss   10:08   0:00 postgres: logger process   
enterpr+  1257  0.0 18.0 624076 276876 ?       Ss   10:08   0:00 postgres: checkpointer process   
enterpr+  1258  0.0 12.3 623920 189224 ?       Ss   10:08   0:00 postgres: writer process   
enterpr+  1259  0.0  0.9 623920 13920 ?        Ss   10:08   0:00 postgres: wal writer process   
enterpr+  1260  0.0  0.1 624348  2796 ?        Ss   10:08   0:00 postgres: autovacuum launcher process   
enterpr+  1261  0.0  0.1 212188  1864 ?        Ss   10:08   0:00 postgres: stats collector process   
enterpr+  1274  0.0  0.6 628896 10156 ?        Ss   10:08   0:01 postgres: enterprisedb edb ::1[54154] idle
enterpr+  7206  0.0  0.0 112648   968 pts/0    R+   13:29   0:00 grep --color=auto postgres

想要觀察 PostgreSQL 這個程式「總」記憶體用量(包含它全部的 Process),可以用下式執行(測試於 CentOS 7,其他 Linux Distribution 可能要微調一下):
[enterprisedb@edbvm ~]# while true
> do
>  ps -u enterprisedb o pid= | grep -o '[^\t ].*' | sed 's#.*#/proc/&/smaps#' | xargs sudo grep ^Pss: | awk '{A+=$2} END{print A}'
>  sleep 3
> done

就會以每三秒列一次 PostgreSQL 記憶體用量(KB)了。

至於有沒有其他方式,以後有遇到再補充。

參考:

2016年8月11日 星期四

pg_ident.conf 設定檔的功能練習筆記

PostgreSQL 的登入控管,是透過 $PGDATA/pg_hba.conf 內的設定控制訪問 IP 與資料庫帳號的登入認證模式。然而, PostgreSQL 還有一個 pg_ident.conf 的管理檔,也和登入控管有關。這個檔案是針對 pg_hba.conf 內認證方法為 ident 以及本機 peer 認證所使用的:設定該檔案,便能夠控制在 ident 認證(ident Authentication)以及本機 peer 認證(peer Authentication)下,作業系統帳號與資料庫帳號的登入對應。
  • 要使用 ident 認證,需要一個 Ident Server 進行控管。可以在本機安裝相關的服務。
  • 本機 peer 認證則單純透過 local socket 連線,不用額外的認證服務。但該選項只限於本機控管(pg_hba.conf 內 METHOD 的設定為 local 的條目)。此外,將 METHOD 為 local 的條目設定成 ident 認證連接的話,找不到 Ident Server 時,就會以 peer 的認證模式進行。

以下在 PostgreSQL 9.5 上進行演練:依照使用手冊所提的,Ident Server 已經比較少地方在用了,所以在此沒建立 Ident Server,僅示範 pg_ident.conf 在 peer 認證模式的狀況。

現在,有一個 OS 帳號 aaa,要賦予他在本機上,能夠以 postgres 資料庫帳號,以 peer 授權認證設定,「直接」登入 PostgreSQL 資料庫。(註:該步驟對於設置 ident 認證也是一樣的)。

首先,在 pg_ident 內
# MAPNAME       SYSTEM-USERNAME      PG-USERNAME
test            aaa                  postgres
test            enterprisedb         postgres
test2           bbb                  postgres

上面設置了兩種對照表,test 以及 test2,這名字將帳號對照分成不同組進行管理。

接著,pg_hba 相應設定
# TYPE  DATABASE     USER       ADDRESS         METHOD
local   all          all                        peer map=test
#host   all          all        127.0.0.1/32     ident map=test2
host   all          all        127.0.0.1/32     md5
#host   all          all        ::1/128          ident map=test2
host   all          all        ::1/128          md5

以上便設置本機為 peer 連線認證,並且依照 pg_ident.conf 裡面 MAPNAME 為 test 的條目進行對照。紅色部份則是設置 ident 連線認證,依照 pg_ident.conf 裡面 MAPNAME 為 test2 的條目進行對照,再這次練習中由於不會作用,於是將它們註解掉。

重新載入資料庫
[postgres@pgvm ~]$ pg_ctl reload

開 log 來看
[aaa@pgvm ~]$ psql  -U postgres -d testdb -p 5432
psql.bin (9.5.3.8)
輸入 "help" 顯示說明。

testdb=#
[postgres@pgvm ~]$ tail -f ~/9.5/data/pg_log/postgresql-2016-08-11_095327.log
...
2016-08-11 16:11:01 CST LOG:  connection received: host=[local]
2016-08-11 16:11:01 CST LOG:  connection authorized: user=postgres database=testdb

上面顯示了成功登入的狀況。
用另外的帳號 bbb 在本機嘗試登入 postgres 這個資料庫帳號
[bbb@pgvm ~]$ psql -U postgres -d testdb -p 5432
psql.bin: FATAL:  Peer authentication failed for user "postgres"

...(承上的 log)
2016-08-11 16:12:06 CST LOG:  connection received: host=[local]
2016-08-11 16:12:06 CST LOG:  no match in usermap "test" for user "postgres" authenticated as "bbb"
2016-08-11 16:12:06 CST FATAL:  Peer authentication failed for user "postgres"
2016-08-11 16:12:06 CST DETAIL:  Connection matched pg_hba.conf line 83: "local    all             all                         ident map=test"

可以看到 bbb 就算在 pg_ident.conf 有紀錄到,但由於是不同的 MAPNAME,於是就被禁止以 postgres 帳號在本機登入。
以上的練習,基本上,使用 Ident Server  也是一樣的效果。

最後一提,若是沒有設置 Ident Server 的話,把上面紅色部份啟用,aaa 帳號就會怎麼樣也連不了(除了對 pg_hba.conf 的 local 條目設定成 ident 認證仍然會有效:沒有 Ident Server 就會被當成 peer 認證)
# TYPE  DATABASE     USER       ADDRESS         METHOD
local   all          all                        peer map=test
host    all          all        127.0.0.1/32    ident map=test2
host    all          all        ::1/128         ident map=test2
[aaa@pgvm ~]$ psql -U postgres -d testdb -p 5432 -h 127.0.0.1
psql: FATAL:  Ident authentication failed for user "postgres"
2016-08-11 15:39:22 CST LOG:  connection received: host=127.0.0.1 port=42333
2016-08-11 15:39:22 CST LOG:  could not connect to Ident server at address "127.0.0.1", port 113: 連線被拒絕
2016-08-11 15:39:22 CST FATAL:  Ident authentication failed for user "postgres"
2016-08-11 15:39:22 CST DETAIL:  Connection matched pg_hba.conf line 87: "host    all             all        127.0.0.1/32           ident map=test"

上面的 log 提到沒有安裝 Ident Service,監聽不到相關的服務,造成連線失敗。


最後,對於 Ident Service,使用手冊提到,該服務只適用在封閉的子網路環境中:因為佈署在外網能存取的地方,有心人士就可能入侵 Client 機器,對 Ident 服務(port 113)進行攻擊。這大概也是為什麼 PostgreSQL 使用手冊提到這功能比較少人用的原因。


參考

2016年8月3日 星期三

EDB-LanguagePack 程式語言套件的 Python/Perl 模組安裝筆記

由於 EDB 提供的 Postgres Distribution (含原生版本以及企業版本)有包裝自己用的 Python/Perl/Tcl Distribution,於是要安裝想在 EDB/Postgres 用到的 PL/Python / PL/Perl / PL/Tcl 模組,就要針對資料庫程式額外安裝。

EDB-LanguagePack 在 EDB 公司提供的 Stack Builder(/Plus)套件安裝程式上可以取得並安裝。安裝後的預設路徑為 /opt/EnterpriseDB/LanguagePack/9.{4,5}/。另外,這個安裝路徑不能更動。

在此示範於 CentOS 下的 LanguagePack 安裝後的設置方式,Windows 版本請參考本文末的產品安裝手冊內容連結。

2016年7月30日 星期六

EDB 的資源管理功能 - Resource Manager

EDB 公司的 PostgreSQL 企業版資料庫,除了原生於社群版本的記憶體配置參數 shared_buffer 可以設定之外,還提供了資料庫的 CPU、I/O 資源使用調控參數 edb_dynatune。更進一步,EDB 還能夠針對資料庫總資源進行分配調控。

Resource Manager 是 EDB 用來控制系統資源使用的功能:對於分配給 EnterpriseDB Postgres Advanced Server(EPAS)的作業系統資源。使用 Resource Manager 建立不同的資源使用規則(Resource Group),便能夠對
  1. 當下 session、
  2. 指定帳戶,或
  3. 指定資料庫
套用某一個資源使用規則。被加入同一個 Resource Group 的 Session / Role / Database,會共同限制分用這個 Resource Group 分配的系統資源。

Resource Manager 可以設定的資源使用規則分成
(1) CPU 資源使用,
(2) Shared Buffer 寫入速率,
兩類。以下便依照使用手冊進行演練一次

  1. 首先啟用 Resource Manager
[enterprisedb@localhost ~]$ vi $PGDATA/postgresql.conf
. . .
edb_max_resource_groups = 3    # 指定要設定幾組資源使用規則
. . .
[enterprisedb@localhost ~]$ pg_ctl restart

  1. 建立一個 Resource Group
edb=# CREATE RESOURCE GROUP resource_gp1;
CREATE RESOURCE GROUP

  1. 設定該 Resource Group 的 資源限制:cpu 設置參數是以比例設置,用小數點指定;shared budder 設置參數 dirty_rate_limit 的單位是 KB/sec
edb=# ALTER RESOURCE GROUP resource_gp1
SET cpu_rate_limit TO .3,
dirty_rate_limit TO 500;
ALTER RESOURCE GROUP

    在此設定 resource_gp1

  1. 檢視現有的 Resource Group 與其資源使用規則
edb=# SELECT * FROM  edb_resource_group;
   rgrpname   | rgrpcpuratelimit | rgrpdirtyratelimit
--------------+------------------+-------------------
 resource_gp1 |              0.3 |               500
(1 row)

  1. 建好資源分配群組後,就能將當下 session 、帳戶或 Database 加入一個 Resource Group 中

    1. 當下運行的 session 使用該一 Resource Group
SET edb_resource_group TO resource_gp1;

    1. 將帳戶 test_user 加入一個 Resource Group 中
ALTER USER test_user
SET edb_resource_group
TO resource_gp1;

    1. 將資料庫 testdb 加入一個 Resource Group 中
ALTER DATABASE testdb
SET edb_resource_group
TO resource_gp1;

  1. 檢視目前各個 Resource Group 資源使用狀況的指令
SELECT * FROM  edb_all_resource_groups;


測試

以下測試,在配有 1 core, 2.6 GHz 的 VM 上進行,並使用外部工具監控 CPU 使用量。

  1. CPU 限制的測試:利用 EDB 進行一樣大小的計算階乘,藉以觀察 CPU 使用狀況
edb=# SELECT 30000!;

另外開一個 psql,查看 Resource Group 使用狀況
edb=# \x
Expanded display is on.
edb=# SELECT * FROM edb_all_resource_groups;
-[ RECORD 1 ]----------------+------------------
group_name                   | resource_gp1
active_processes             | 1
cpu_rate_limit               | 0.3
per_process_cpu_rate_limit   | 0.298687974561313
dirty_rate_limit             | 500
per_process_dirty_rate_limit | 16777216

由此可以即時觀察到 CPU 使用率有被 Resource Group 規則限制住。

    再觀察 CPU 使用狀況
圖上顯示了兩組測試的CPU使用率的活動:
第一組是 CPU 利用率 100% 的活動,是在沒有啟用 Resource Group 前進行的 30000 階乘計算,
而第二組 CPU 使用率限制在 30% 的活動,則是在啟用 Resource Group 後進行的 30000 階乘計算

以上可見,Resource Manager 在 CPU 使用量控管的效果。

  1. 要測試 Resource Manager 對 Shared Buffer 的管理,則是利用運作時間來比較。
         為了測試方便,會以修飾語句 WITH (FILLFACTOR = 10)建立表格:該語句會使的 Shared Page 數量增加,以進行此部份 Shared Buffer 限制功能的測試

先建立表格
CREATE TABLE t1 (c1 INTEGER,
c2 CHARACTER(500))
WITH (FILLFACTOR = 10);

以輸入一萬筆資料的方式進行測試。先進行不設定 Resource Group 的部份。
edb=# \timing
Timing is on.
edb=# INSERT INTO t1 VALUES (generate_series (1,10000), 'aaa');
INSERT 0 10000
Time: 266.969 ms

接著,在這個 session 啟用剛剛建立的 Resource Group,並再次插入一樣大筆的資料:
edb=# SET edb_resource_group TO resource_gp1;
SET
Time: 0.341 ms
edb=# INSERT INTO t1 VALUES (generate_series (1,10000), 'aaa');
INSERT 0 10000
Time: 158725.910 ms

比較以上橘色反白所列時間,可見到 Resource Group 限制造成資料寫入的速率影響,由此可見 Resource Group 對 Shared Buffer 限制影響的是在資料寫入速率。

以上便是 EDB 的企業版的資源管理功能。該功能最簡單的應用,就是可以用來建立測試區 Database,並限制住該區的資源,避免去影響到資料庫於線上正式的工作。

2016年7月29日 星期五

PostgreSQL 9.5 的 pg_rewind 工具操作筆記

設置 Streaming Replication 的用途主要是以複寫資料庫作為備份,在工作主機下線時,可以切換(promoting)到其他備份頂替工作。

但是切換後,回復 Streaming Replication 就是首要工作。有時候,這個設置就會變得有點累人:舊的工作機資料已經沒辦法直接和現在運作的資料庫銜接,需要重新從全備份開始,設置 Streaming Replication 才行。資料量大的狀況下,從全備份開始就會耗費不短的時間。
Note:由於 PostgreSQL 的交易紀錄有標記 Timeline,Promoting 之後,Timeline 便脫勾了。因此 Promoting 之後的新舊工作機資料,無法用來建立 Streaming Replication。

在 PostgreSQL 9.5 版,提供了一個叫 pg_rewind 的工具,這工具便能善用舊的工作機資料,和目前線上工作的資料庫銜接資料差異。使的再次建立 Streaming Replication 不用從 pg_basebackup 開始,減輕再次建置 Streaming Replication  的麻煩,更快恢復 Streaming Replication。

pg_rewind 利用比較新舊工作機的交易日誌 WAL,標記兩份資料庫 $PGDATA 的差異並補上,於後就可以啟動 Streaming Replication。

以下練習,將在同一台電腦上開啟兩個之間有 streaming replication 的 Postgres cluster 進行演練。演練中也加上 Physical Replication Slot,便不再去特別點出。

以下為這次練習的設置環境

DB Cluster 資料夾位置
port
WAL archived 目錄
工作的 instance db1
/home/postgres/pgsql/db1/
5432
/home/postgres/pgWALs/db1/
備份的 instance db2
/home/postgres/pgsql/db2/
5433
/home/postgres/pgWALs/db2/


1) Rewinding 相關前置設定
要使用 pg_rewind 功能,需要在設定檔中啟用交易日誌檔 WAL 相關的功能:這需要在建立 Streaming Replication 之前就設置好。
/home/postgres/pgsql/db1/postgresql.conf
port = 5432
wal_level = hot_standby
full_page_writes = on     # Rewinding 所需參數
wal_log_hints = on        # Rewinding 所需參數
archive_mode = on       # Rewinding 所需參數
archive_command = 'cp %p /home/postgres/pgWALs/db1/%f'   # Rewinding 所需參數
max_wal_senders = 3
max_replication_slots = 1
hot_standby = on          # 在 Standby Instance 上面才會載入

2) 接著便繼續完成 Streaming Replication 的設置
[postgres@pgvm ~]$ # db1 的設定
[postgres@pgvm ~]$ echo "host  replication  repuser  127.0.0.1/32  trust" >> /home/postgres/pgsql/db1/pg_hba.conf
[postgres@pgvm ~]$ pg_ctl -D ~/pgsql/db1/ restart
[postgres@pgvm ~]$ psql -p 5432 -c "CREATE USER repuser WITH REPLICATION;"
[postgres@pgvm ~]$ psql -p 5432 -c "SELECT pg_create_physical_replication_slot('myslot1');"
[postgres@pgvm ~]$ # 建立 db2
[postgres@pgvm ~]$ pg_basebackup -h 127.0.0.1 -p 5433 -D ~/pgsql/db2 -U repuser -v -P
[postgres@pgvm ~]$ vi /home/postgres/pgsql/db2/postgresql.conf
port = 5433
archive_command = 'cp %p /home/postgres/pgWALs/db2/%f'
[postgres@pgvm ~]$ vi /home/postgres/pgsql/db2/recovery.conf
standby_mode = 'on'
primary_conninfo = 'host=127.0.0.1 port=5432 user=repuser'
restore_command = 'cp /home/postgres/pgWALs/db1/%f %p'
primary_slot_name = 'myslot1'
trigger_file = '/home/postgres/pg_trigger'
[postgres@pgvm ~]$ pg_ctl -D ~/pgsql/db2/ start

以上便將 Streaming Replication 建立完畢。不熟悉的人,可以參考另一篇 Streaming Replication 的筆記。

3) 在已經建立好的 Streaming Replication 中,在備份程序上執行 promote,使的 streaming replication 結束複寫連線(切換 Timeline),並使的備份機可以接替工作機運作:
[postgres@pgvm ~]$ pg_ctl -D ~/pgsql/db2/ promote

由於現在是執行 promote,db1 其實還在運作。但一般在切換後,db1 便不再工作,而現在db1 還在執行,所以在此把 db1 關掉。
[postgres@pgvm ~]$ pg_ctl -D ~/pgsql/db1/ stop

4) 執行 pg_rewind 之前 ...
一般來說,db2 會工作一段時間之後,才會去進行回復 Streaming Replication 的設置(因為不可能資料庫異常一發生,就馬上去處理 … ),因此 db02 已經會產生一些交易了。於是在這裡我產生一些資料到 db2 裡面,模擬執行 pg_rewind 之前已經產生的交易。
[postgres@pgvm ~]$ psql -p 5433 -c "CREATE TABLE test2 AS SELECT * FROM pg_description, pg_class;"

這個指令在空的 instance 上,會產生約莫 1GB 的資料大小 ...,足以模擬前述狀況了。

5) pg_rewind 前置作業
由於 pg_rewind 需要比對新舊資料庫的 WAL 交易日誌,找出分歧點,並設置 Timeline。所以在執行 pg_rewind 之前,我們需要提供足夠的 WAL 檔案。
[postgres@pgvm ~]$ # 把 db1 切換前產生的 WAL 移回 db1/pg_xlog
[postgres@pgvm ~]$ mv ~/pgWALs/db1/* ~/pgsql/db1/pg_xlog/
[postgres@pgvm ~]$ # 把 db2 切換後產生的 WAL 「複製到」
[postgres@pgvm ~]$ # db1/pg_xlog 裡(不是 db2/pg_xlog/!)
[postgres@pgvm ~]$ cp ~/pgWALs/db2/* ~/pgsql/db1/pg_xlog/

上面複製了新舊的 WAL 備份檔到 db1 的 pg_xlog/。這是為了提供追溯比對交易分歧點之用。目前沒有方式估計究竟需要回溯多久的 WAL 備份檔,只知道越快進行 pg_rewind,所需的 WAL archives 檔越少。
另外,運作中的 DB Master (db2)的 pg_xlog/ 目錄會清理(Rotation),所以得將 db2 的 WAL archives 都塞到舊的 DB Master (db1)的 pg_xlog/ 裡面,而非複製回 db2 的 pg_xlog/ 裡。

6) 執行 pg_rewind:這個指令,要在 db1 所在的主機上執行,並指定到連線到目前工作中的 db2
[postgres@pgvm ~]$ pg_rewind -D ~/pgsql/db1/ --source-server="host=localhost port=5433 user=postgres dbname=postgres" -P

這個過程,pg_rewind 會從原先留在 db1、db2 雙邊 pg_xlog/ 裡,最新的 WAL 檔開始回溯比較,再比較到新舊 Master 的 WAL archives(剛剛已經都被我們複製到 db1/pg_xlog/ 裡面了),直至分歧點,放上標籤,並開始複製需要的「差異資料」內容。

7) 修改 db1 設定檔內容:pg_rewind 會連同設定檔一起「同步」到 db1,所以 db1 上舊的設定檔就被 db2 的蓋掉了,於是要作一些必要調整。

/home/postgres/pgsql/db1/postgresql.conf
port = 5432
archive_command = 'cp %p /home/postgres/pgWALs/db1/%f'

把 db1 上的 recovery.done 更名為 reocvery.conf 並修改內容
[postgres@pgvm ~]$ mv ~/pgsql/db1/recovery.done ~/pgsql/db1/recovery.conf
[postgres@pgvm ~]$ vi ~/pgsql/db1/recovery.conf
primary_conninfo = 'host=127.0.0.1 port=5433 user=repuser'
restore_command = 'cp /home/enterprisedb/pgWALs/db2/%f %p'

8) 啟動 db1,成為 db2 的複寫備份
[postgres@pgvm ~]$ pg_ctl -D ~/pgsql/db1/ start

這過程中,如同一般 Streaming Replication 一樣,會進行交易日誌的重演(Replay),然後進入同步的唯讀模式

9) 檢查 Streaming Replication 狀態
就像檢視一般 Streaming Replication 同步一樣,連線到 db2 上檢視 Streaming Replication
[postgres@pgvm ~]$ psql -p 5433 -c "SELECT * FROM pg_stat_replication;"

檢視切換資料庫後的狀況
  • db1 目前狀況工作程序
[postgres]$ pg_controldata -D /home/postgres/pgsql/db1/ | grep "cluster state"
Database cluster state:               in archive recovery

  • db2 instance(現在是工作機了)
[postgres]$ pg_controldata -D /home/postgres/pgsql/db2/ | grep "cluster state"
Database cluster state:               in production

以上可見, Streaming Replication 已經再次設置成功了。
以上就是 pg_rewind 的操作範例。


最後再提醒一下,
(1)要使用 pg_rewind 功能,需要在新舊 Master 資料庫上,有分別留下 WAL 交易日誌,才能正常操作。
(2)此外,pg_rewind 還不會回溯到 WAL Archives,因此資料庫脫勾時間過得久了,pg_rewind 就不夠幫忙了:需要把「足夠的」舊資料庫 WAL 交易日誌檔,「以及新資料庫的 WAL 交易日誌檔」,放進去準備要進行 Rewinding 的 pg_xlog/ (Old Master)裡面才行。至於這個「足夠」是多少... 可能得等其他專家來解謎了。或是期待 pg_rewind 可以提供追溯 WAL archive 目錄的功能了。
(3)其實這個工具,在 PostgreSQL 9.5 之前就存在了,只是還沒正式納入 PostgreSQL 工具裡面而已。

雖然目前有上述複製 WAL 檔案的小小不便,但相較於之前都得把 db1 打掉重練,有了這個 pg_rewind,看起來就好多了...


參考資料


相關:Logical Decoding 功能